Socialize AgencySocialize Agency
  • Home
  • About Us
  • What we do
  • Our Work
  • News Room
  • Join us
  • Contact Us
  • Home
  • About Us
  • What we do
  • Our Work
  • News Room
  • Join us
  • Contact Us
April 26, 2019

The state of digital in April 2019: all the numbers you need, and a few big surprises

  • Posted By: Aurelien Fonteneau/
  • 0 comments /
  • Under: Insights


It’s only been three months since We Are Social published our first round of Digital 2019 reports, but our new Q2 Global Digital Statshot shows that the connected world has already changed considerably during that time.


For regional insights, see our analysis of Digital In Saudi Arabia.

Essential headlines

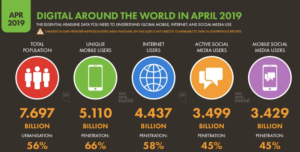
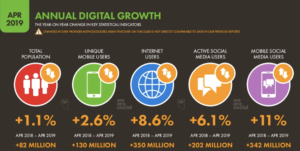
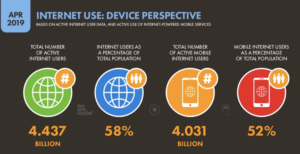
  • Global internet users grew by 8.6 percent over the past twelve months, with 350 million new users contributing to an overall total of 4.437 billion by the start of April 2019.
  • Social media user numbers have also registered solid growth, increasing by more than 200 million since this time last year to reach almost 3.5 billion by the time of publication. However, recent changes in Facebook’s reporting methodology mean that actual growth was probably even higher.
  • There are now more than 5.1 billion people around the world using a mobile phone – a year-on-year increase of 2.7 percent – with smartphones accounting for more than two-thirds of all devices in use today.
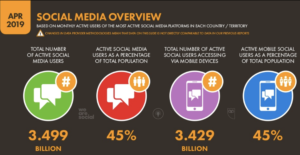
  • Roughly 98 percent of the world’s social media users – more than 3.4 billion people – access social platforms via mobile devices.  

Internet use in April 2019

The latest reported figures suggest that an average of almost 1 million people came online for the first time each day over the past year, continuing the strong growth that we saw in our recent Digital 2019 reports.

India accounted for the greatest share of growth in internet users in the first quarter of 2019, with data from the Telecom Regulatory Authority of India showing that the country added more than 44 million new internet subscribers in the first three months of the year.

CNNIC’s February 2019 report (in Mandarin) also shows meaningful growth in the number of internet users in China, with the total increasing by 29 million new users since the organisation’s previous report in August 2018.

The growing role of voice

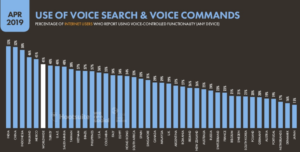
GlobalWebIndex’s latest data show that more than 4 in 10 internet users made use of voice commands and voice search in the past 30 days, but that adoption of these tools varies considerably around the world.

Perhaps most tellingly, the use of voice is most common in India, China, and Indonesia – countries that already have some of the world’s largest internet populations, but that are also experiencing some of the greatest increases in new internet users.

What’s more, despite Western media’s fixation on smart speakers like Amazon’s Echo devices, it’s important to stress that the majority of voice users are making use of voice functionality for everyday activities on their mobile phones.

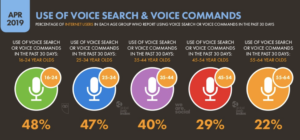
This is particularly true of younger users, many of whom have not yet developed ‘fixed’ habits when it comes to using digital devices and services. Indeed, the latest data from GlobalWebIndex shows that almost half of all internet users aged 16 to 24 already use voice, compared to less than 30 percent of users aged 45 and above.

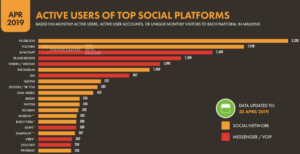
Social media use in April 2019

Almost 3.5 billion people around the world now use social media, with roughly 98 percent of them accessing social platforms via mobile devices.

Overall, Facebook Inc.’s portfolio of services continues to dominate the global social landscape, while Tencent has further consolidated its lead position in Mainland China.

Exploring each platform’s latest advertising audience numbers offers another valuable perspective on social media use though, so let’s take a closer look at the key developments and trends in those numbers over the past three months.

Facebook

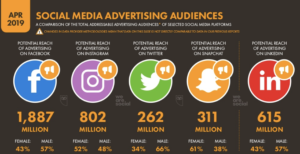
Facebook recently made some fundamental changes to the ways in which it reports advertising audience numbers across its various platforms so we can’t compare like-for-like growth trends this quarter. But the good news is that these changes let advertisers to build a clearer picture of the number of people they’re able to reach with ads on each of Facebook’s platforms.

The company’s Insights tools had previously been showing steady declines in users’ median number of ad clicks over the past three quarters, the latest data show much healthier figures.

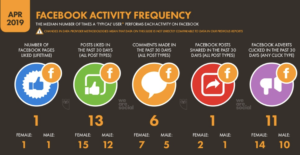
However, changes in audience definitions and reporting methodology mean that these figures can’t be compared on a like-for-like basis to previous reports, so these healthier figures do not necessarily mean that people have actually been clicking on more ads, nor can we be sure whether people have been sharing or commenting on Facebook posts more frequently.

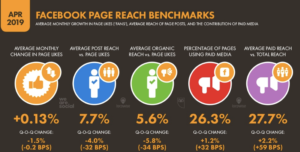
Indeed, the latest insights from Locowise reveal that engagement with Facebook Page posts continues to decline, with the average post now garnering a response rate of just 3.6 percent – a relative drop of 3.4 percent in just the past three months.

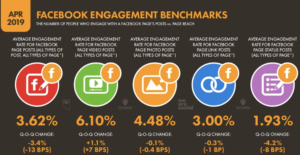
Meanwhile, organic reach for Facebook Page posts also continues its relentless downward trajectory, with Locowise reporting that barely 1 in 18 of a Page’s fans now see posts without paid media support – a relative decline of almost six percent in just the past three months.

Instagram

Facebook has made the same definition changes in its reporting of Instagram audiences, and – interestingly – this has resulted in similar patterns to those we saw above for Facebook.

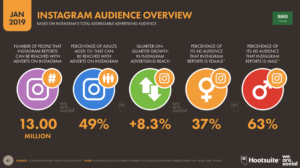
Instagram announced that it had passed the billion active accounts milestone back in June 2018, but the latest figures in Facebook’s self-serve advertising tools suggest that the company only showed adverts to 802 million Instagram users in March 2019.

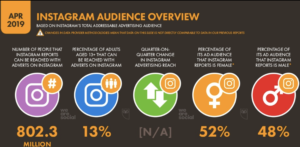
The advertising audience data that we collected prior to the recent change in Facebook’s audience definitions show that the number of Instagram users aged 13 to 17 fell by more than 3 percent between October 2018 to January 2019. All other age groups showed very healthy growth, and overall, the size of Instagram’s advertising audience actually increased by more than 4 percent during the same period (October 2018 to January 2019).

If Instagram is losing younger audiences, the big question is: where are they going? As usual, there’s plenty of speculation here, so let’s look at what the data tells us…


TikTok

In my recent conversations with senior marketers, journalists, and even the world’s biggest investors, it’s clear that many people believe TikTok is “the next big thing” in the world of social. And with the company already claiming more than 500 million active users – and more than a billion downloads – it’s easy to see why.

TikTok doesn’t publish audience figures to the same level as peers like Snapchat and Instagram though, so we need to look at some different data sources to get a sense of TikTok’s current status and growth.

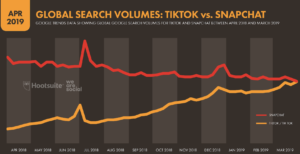
A good place to start is Google Trends, which shows that worldwide interest in TikTok has grown significantly over the past year.

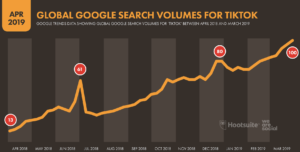
Google Trends data shows that worldwide interest in TikTok is already on a par with Snapchat (note that the TikTok trendline in the chart below also includes searches for “Tik Tok” – i.e. with a space – which appears to be a common variation in spelling for searches relating to the platform).

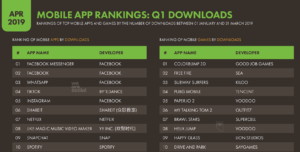
SensorTower reports that TikTok added 188 million new users in the first three months of this year, and the company ranks the app as the number one top performer in Apple’s iOS app stores for Q1 2019.

Meanwhile, App Annie reports that TikTok ranked fourth overall in the world’s most downloaded apps across iOS and Google Play stores for the whole of Q1.

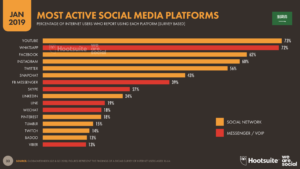
That puts TikTok behind Facebook, Messenger, and WhatsApp, but ahead of Instagram:


Snapchat

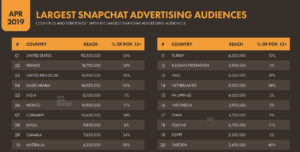
After a worrying start to the year, Snapchat saw some more reassuring trends in its advertising audience numbers this quarter, with the platform’s total addressable audience growing by 1.2 percent since January.

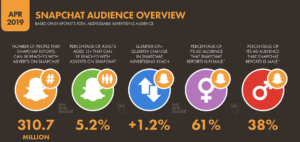
India accounted for almost a quarter of the growth in Snapchat’s audience over the past three months, and it also saw disproportionate growth in Russia this quarter, with the platform’s audience in the country up by almost eight percent in the past three months.

Interestingly, Snapchat’s self-serve advertising tools also report a slight increase in the size of the platform’s audience in the United States – a finding which seems to go against media speculation that the platform would see declines in its US user base this year.

The data alone don’t reveal the cause of this reversal in Snapchat’s fortunes, but there’s a possibility that recent improvements to the platform’s Android app have revived interest amongst previously frustrated users.


Twitter

The figures that Twitter publishes in its self-serve advertising tools tend to fluctuate significantly – even over short periods of time – which can make it trickier to identify precise trends for the platform.

However, the latest data suggest that Twitter also saw overall growth in its advertising audience in the first three months of 2019, with the global addressable audience up by 4.5 percent since January.

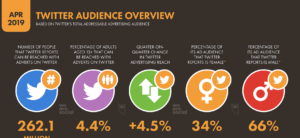
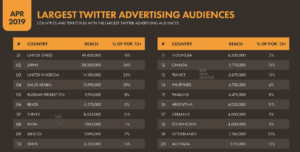
Twitter’s largest reported gains were in Russia, where the platform’s advertising audience grew by almost five times over the past three months, up from just over two million in January to almost 10 million at the time of writing.

Meanwhile, Twitter’s self-serve advertising tools also show an audience increase of almost 2.5 million in the United States, equating to quarter-on-quarter growth of more than five percent.


LinkedIn

The world’s most active professional social network saw good growth again in the first quarter of 2019, with the platform’s self-serve advertising tools reporting an increase of 1.7 percent in its total addressable audience.

Advertisers can now reach almost 615 million people on LinkedIn, although it’s worth highlighting that these figures are based on registered users, rather than the monthly active user figures reported by most other platforms.

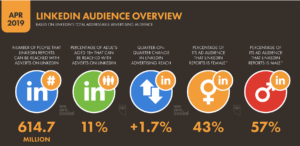
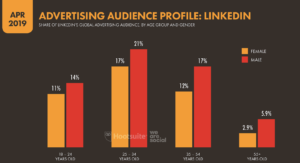
Interestingly, the quarter-on-quarter trends suggest that LinkedIn is growing fastest amongst the 18 to 24-year-old group, who now account for roughly 25 percent of the platform’s total advertising audience.


Discord

Discord is a new entrant to our ranking of the world’s most active social platforms, having recently exceeded a quarter of a billion active users.

Discord is a messaging platform that’s hugely popular with the world’s billion-plus online gamers, which should be more than enough reason for marketers need to add it to their list of potential opportunities.

However, it’s Discord’s focus on communities that makes it particularly interesting as a platform, especially in a world where privacy concerns are increasingly important drivers of people’s social media preferences and behaviour.

If you’re new to Discord, or if you’d like a handy explainer, check out this great overview video from CNBC, complete with excellent stats and founder interviews:


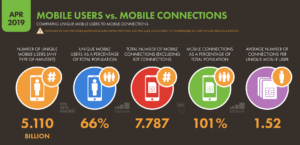
Mobile use in April 2019

Our partners at GSMA Intelligence have revised their historical data for unique mobile users since January, but the worldwide total has since returned to the figure of 5.11 billion that we reported in our Digital 2019 report.

After the revisions, GSMA Intelligence reports that unique mobile users have grown by roughly 2.6 percent over the past twelve months, equating to an additional 130 million new mobile users since this time last year.

Note that we’ve changed the way we report mobile subscriptions too, and the 7.787 billion figure we’re quoting in this quarter’s report no longer includes IoT connections.

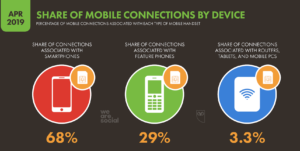
The latest data from Ericsson shows that smartphones now account for 68 percent of mobile connections, with feature phones’ share of connections dropping below 30 percent for the first time.

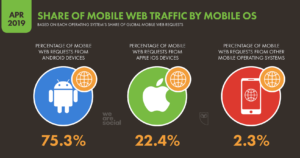
Meanwhile, Android has strengthened its control of the mobile market, with the latest data from Statcounter showing that the Alphabet-owned operating system accounted for more than three-quarters of all mobile handsets that access the web in March 2019.

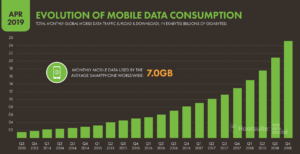
Our addiction to mobile data shows no signs of slowing either, with Ericsson reporting that monthly data consumption grew by an average of more than 4 billion gigabytes over the last quarter of 2018, to reach 25 exabytes per month.


January 30, 2019

Digital in 2019 | Saudi Arabia

  • Posted By: Aurelien Fonteneau/
  • 0 comments /
  • Under: Insights , News

Saudi Arabia in 2019: A Year of Digital Growth

Socialize, in conjunction with We Are Social and Hootsuite, the world’s leader in social media management, today released their Digital 2019 report, examining social media and digital trends around the world.
Here is a look at the most significant data coming out of the Saudi Arabia report, giving us a first understanding at the possible trends, changes and behaviors that could shape the year ahead.

Digital 2019 Saudi Arabia (January 2019) v01 from DataReportal
Saudi Arabia leads the world in Snapchat, but Instagram is coming
Saudi currently has the world’s largest monthly active Snapchat audience, with almost 14m users.
However, since the end of 2018, there’s been a sharp drop of 15% in active Snapchat users, while Instagram’s user base has grown 8% in 2018, catching up quickly with 13m active users.
Instagram audience overview in Saudi Arabia

Instagram audience overview in Saudi Arabia

Facebook is still slightly ahead of them both with 15m, but it wouldn’t be a big surprise to see Instagram overtake them both as the year goes on.

Saudis are more likely to click on a Facebook ad than publish a post
On average, Saudis will click on six Facebook ads each month, while they only publish four posts, comment twice and share once. It’s a clear exhibition of how behavior on Facebook is shifting from content creation to content consumption.

This could also be an indicator of greater value being placed on the protection of personal information, given the increasing concern for social privacy.

E-commerce is thriving
While Saudi Arabia lags behind the global average when it comes to online spending, the last year has seen tremendous growth, with 64% of Saudis now saying they purchase a product or service online on a monthly basis.

This behavior is heavily weighted towards mobile, with 51% of people making a purchase on a phone, compared to just 24% on a laptop/desktop computer.

E-commerce spend by category in Saudi Arabia

E-commerce spend by category in Saudi Arabia

In 2018, the total value of the consumer goods e-commerce market in Saudi Arabia was estimated at $6.36 Billion, up 15% from the previous year. The highest spend was seen within the travel (including accommodation) category, which accounted for 50% of total online spend.

Video streaming and messenger apps dominate mobile activity
Of all internet users in Saudi, 89% use mobile messenger apps every month – an increase of 6% since last year. Similarly, 90% of Saudis now watch videos on their mobile each month, a rise of 8% in the same time period.

Most active social media platforms in Saudi Arabia

Most active social media platforms in Saudi Arabia

It’s unsurprising then, that the platforms with the highest penetration across the Kingdom of Saudi Arabia (survey based) are YouTube and Whatsapp.


October 17, 2018

Q4 2018 internet report: Almost 4.2 billion humans are online

  • Posted By: Socialize/
  • 0 comments /
  • Under: Insights , News

The 2018 Q4 Statshot report from We Are Social Global Consultant Simon Kemp is in – and as usual there are a number of interesting developments happening every single day in the world of social and digital. Read on to find out more…


The State of the Internet in Q4 2018

The data in Hootsuite and We Are Social’s new Q4 Global Digital Statshot report reveal that the ‘Next Billion’ is fast becoming a reality, as more and more people across the developing world connect to the internet.

Millions of people across Africa and South Asia came online for the first time in the past three months, with almost all of these new users accessing the internet solely via mobile devices.

There have been some meaningful changes to social media numbers too, although some of the most interesting findings in this quarter’s report relate to declines in social media audiences, especially amongst younger Facebook users.

It’s also been a bumper quarter for mobile, with global users spending $20 billion on apps in the past three months – that’s equivalent to more than $150,000 every minute between July and September.

You can read the full report in the SlideShare embed below, but read on for our in-depth analysis and commentary on the most important findings.

Digital 2018 Q4 Global Digital Statshot (October 2018) (v2) from DataReportal

Key numbers

Here are the essential headlines from this Q4 report:

  • There are almost 4.2 billion internet users around the world in October 2018, up 7 percent since this time last year.
  • Around 3.4 billion people around the world used social media in September 2018, up 10 percent versus September 2017.
  • More than 5.1 billion people now use a mobile phone, with most using a smartphone.

Connecting the future

68 million people came online for the first time between July to September 2018, which translates to growth of more than 1.5 percent in just three months. That roughly matches the pace of growth over the past year: 284 million new users have come online since September 2017, equating to year-on-year growth of roughly seven percent.

Social media users are growing even faster though, with 320 million new users signing up between September 2017 and October 2018. Growth in social media use via mobile devices takes things a step further, with almost a million people starting to use mobile social for the first time every day over the past year.

Data from GSMA Intelligence shows that more than two-thirds of the world’s population now owns a mobile phone, with roughly 60 percent of these people owning a smartphone. As a result, mobile growth trends are a little slower than those for internet or social media use, but roughly 100,000 people started using a mobile phone every day over the past year.

The total number of mobile subscriptions in use in October 2018 stands at 8.9 billion. That means that the average mobile user still maintains more than one mobile number, but the average number of subscriptions per user continues to fall as people consolidate mobile activities onto a single device.

Mobile first

Mobile still accounts for more than half of all global web traffic, but the share of traffic coming from laptops and desktops has actually increased by two percent over the past year.

The share of total web traffic coming from other devices – including tablets – continues to decline, but this may be in part due to an increase in the total volume of traffic from mobile phones and laptops, rather than because people have reduced their use of devices like tablets.

Despite the slight fall in mobile’s share of total web traffic, people report that they are significantly more likely to turn to their phones when they want to go online. The latest findings from Google’s Consumer Barometer survey suggest that we’re five times more likely to choose our phones over a computer or tablet when it comes to accessing the internet.

There are a few potential reasons for this imbalance between stated device preferences and actual web traffic.

Firstly, many people still perform work-related internet activities via a computer, and these activities likely account for a sizeable share of overall web traffic (considering that work time accounts for a significant portion of our waking hours).

Similarly, people often turn to mobile devices for ‘quick-fix’ needs such as checking the weather or performing simple web searches. While these activities account for a meaningful share of online session frequency, they don’t require people to browse through numerous different pages to achieve their desired outcome, so this frequency doesn’t necessarily translate into an equal share of total web traffic.

Differences in connection speed may also play a meaningful role in influencing which devices people use, with the average fixed internet connection still twice as fast as its mobile equivalent.

Mobile speeds dip

Indeed, the average global mobile connection speed decreased slightly over the past three months, while average fixed speeds are up by more than three percent since July.

Singapore tops Ookla’s fixed connection rankings with an average speed of 189 Mbps. Connections in six countries around the world now average more than 100 Mbps.

Norway tops the mobile rankings with an average connection speed of 63 Mbps, just ahead of Qatar. Mobile connection speeds now average more than 50 Mbps in eight countries around the world.

Top websites

Alphabet Inc. continues to dominate the world’s top website rankings, with SimilarWeb and Alexa both putting Google.com and YouTube.com in the top two positions. SimilarWeb also features three more of the company’s local search sites in its top 20 ranking: Brazil, India, and the UK.

There have been some changes in these top rankings though, and the rise of the AMP Project is particularly worthy of note. AMP’s efforts to provide publishers with a faster mobile experience seem to be paying off, with SimilarWeb ranking AMP the 17th most-visited site on the internet in its latest monthly rankings.

Meanwhile, shopping sites continue to feature heavily in Alexa’s website ranking, with Chinese e-commerce sites in particular consolidating their grip. The company’s latest global data suggest that both Tmall and Taobao now attract significantly more visitors than Amazon, although their data doesn’t offer any insights into how many of these visitors turn into paying customers, or how much they spend.

Fashion forward

GlobalWebIndex’s research can help us make sense of broader conversion trends, though. The company’s latest data show that nine in every ten internet users visits at least one online retail site each month, and three-quarters go on to actually buy something.

Shopping behaviours vary slightly between men and women, with women more likely to use a shopping app on their mobile compared to men.

Data from Statista’s Global Consumer Survey shows that fashion remains the most popular category for online purchases, with clothing and shoes topping the list of e-commerce purchase categories in the past twelve months.

These categories also captured the greatest share of total e-commerce spend during 2017, as we reported in our larger annual report back in January.

More talk, more action

Most internet users still research brands and products online, but Statista’s latest data suggests that there are some meaningful differences across countries. Four in five shoppers in Brazil say that they ‘always’ conduct online research before making a major purchase, but in China, that figure is barely one in three.

And talking of search, GlobalWebIndex’s latest data shows that people are increasingly turning to voice to help them find what they’re looking for. 38 percent of internet users surveyed around the world in Q2 report using voice-enabled features in the past 30 days, and that figure jumps to 45 percent and above when we zoom in on users below the age of 35.

Interestingly, the data suggest that people in developing economies are more likely to use voice search than people in more developed markets, with almost half of all internet users across India, China, and Indonesia reporting that they used voice search or voice commands in the past month.

Privacy concerns vary by country

Privacy fears have been a recurring theme throughout 2018, so we’re pleased to include some new insights from Statista in this new report. The company’s most recent Global Consumer Survey found that 42 percent of the world’s internet users fear that their data is being “misused” online, although – once again – there are some significant differences across cultures.

There are no clear trends in this data to suggest why people in one country might have more heightened privacy concerns than those in other countries, but it’s worth pointing out that users in Spain – where the levels of concern are greatest – are more than twice as worried as users in Nigeria.

Losing face?

Mark Zuckerberg probably won’t remember 2018 amongst his favourite years, but Facebook continues to grow its global user base despite the various scandals and setbacks that the company has faced over recent months.

The world’s largest social site added 38 million new users in the three months to June, representing 1.7 percent growth quarter-on-quarter. That growth might not have been everything that investors were hoping for, but Facebook still accounts for roughly two in every three of the world’s social media users.

Facebook’s advertising tools suggest that growth hasn’t slowed through Q3 either, with the platform’s latest audience data reporting growth of 65 million users since July. However, these numbers only reflect changes in the platform’s potential advertising audience, and may not translate into similar growth in monthly active users.

The latest advertising audience numbers contain some bad news for the Mountain View team, too. In particular, the latest numbers show that advertisers can now reach 3 million fewer 13 to 17 year-olds on Facebook compared to July 2018, with young women leaving the platform even faster than young men.

Snap ’em up

But Facebook’s loss may be Snap’s gain. We’re pleased to be able to offer detailed insights into Snapchat’s advertising audience for the first time in this new report, and the numbers are quite revealing.

It might not come as a surprise that Snapchat’s average user is significantly younger than Facebook’s, but the gender balance will certainly be of interest, especially to marketers.

Almost six in ten users in Snapchat’s global advertising audience are female, compared to a 57:43 male:female skew on Facebook. In some countries however, Snapchat’s data suggests that the platform’s advertising audience is even more female-skewed. In Kazakhstan, for example, female users account for a whopping nine in ten of the total potential advertising audience.

The United States accounts for slightly less than one-third of Snapchat’s total advertising audience, but the rest of the ‘top 20’ countries shows some good diversity. So, while the company’s latest user growth figures may have disappointed investors, the platform still offers global marketers an interesting opportunity to reach younger, female audiences.

A key question remains though: is Snapchat the best channel to reach these younger audiences, or is Instagram a better bet?

Social climbing

The answer to that question depends on a large number of different factors, most of which will be specific to the advertiser’s particular needs and context.

However, audience reach will likely play an important role in decision-making, so it’s worth noting that Instagram’s overall advertising audience is more than double the size of Snapchat’s audience.

But what about that elusive, younger demographic?

Here are the cold, hard facts:

  • Global users below the age of 25 that advertisers can reach with Instagram ads: 196 million
  • Global users below the age of 25 that advertisers can reach with Snapchat ads: 329 million

But Instagram doesn’t just appeal to Gen Z. In fact, the latest figures show that brands can now reach more than 100 million users over the age of 45 via Instagram ads.

Perhaps Zuck still has something to smile about after all.

It’s not all good news for advertisers though, with the latest data from Locowise showing that organic Facebook reach continues to decline.

The average Facebook page reached 5 percent fewer people organically in Q3 versus Q2, and page owners can now expect to reach just 6 in every 100 of their fans if they don’t boost posts with paid media.

Recent algorithm tweaks seem to be working in Facebook’s favour, with the number of pages investing in paid media increasing by four percent in the past three months.

However, Locowise’s latest data suggest that these paid investments aren’t delivering the impact that they used to. The average contribution of paid reach as a percentage of total page reach has dropped by four percent in the past quarter, suggesting that either pages are getting less reach for their investment, or that they’re simply investing less (even though a greater number of pages now invest in paid media).

Either way, marketers should explore the broader trends in the Facebook reach and engagement numbers across our previous reports to help inform their social media strategies for 2019 – you’ll find the Q1 data here, Q2 here, and Q3 here.

Furthermore, if previous years are any indication of a ‘pattern’, it’s likely that Facebook will introduce yet more changes to its algorithm in early 2019, and it’s unlikely that these changes will work in brands’ favour.

As a result, my advice to marketers would be to take a more ‘balanced diet’ approach to social media in their plans for next year, and to avoid putting all of their eggs in one (Facebook) basket. You’ll find detailed breakdowns of the potential advertising for each of Facebook, Instagram, Twitter, LinkedIn and Snapchat in the report embed at the top of this post.

Don’t worry, be appy

It’s been a good few months for mobile apps, with App Annie reporting some impressive stats in its latest quarterly round-up.

Of particular note is the fact that the total amount of money spent on mobile apps around the world in Q3 reached $20 billion, up 20 percent versus this time last year.

This spend equates to roughly $3.70 for every smartphone in use today, with mobile games claiming the lion’s share of this revenue.

But it’s not all about games: Netflix and Tinder continue their impressive standing in the top-grossing apps in the App Annie’s global latest ranking.

Our insatiable appetite for mobile data shows no signs of slowing either, with the latest numbers from Ericsson suggesting that the average global smartphone user now consumes more than 3.8GB of mobile data each month.

Forecasts for 2019

All the data in this final update report for 2018 suggest that we’ll have plenty of exciting stories to report in our flagship 2019 Global Digital report, which we’ll be publishing in late January.

In particular, look out for:

  • Accelerating growth in internet users across developing economies, especially in Africa.
  • Continued strong growth in overall social media user numbers, but some meaningful declines in the audiences of individual social media platforms.
  • A jump in the total value of consumer e-commerce spending, with strong growth in areas such as fashion and grocery.

We’ll also be reporting some longer-term growth trends based on the data we’ve collected over recent years, and we’ll be adding a wealth of new data points too.

To give you an idea of what you can expect, here’s a ‘replay’ of our January 2018 report:

Digital 2018 Global Digital Overview (January 2018) from DataReportal

Categories
  • Best-Practices
  • Influencers Q&A
  • Insights
  • News
  • Uncategorized
Tags
#BraveTheBacklash 2019 advertising Announcement Automotive best practice Campaign ChatBot digital Digital report equality Expansion Facebook Facebook Marketing FMCG Global Growth Hong Kong hootsuite Influencers insights Instagram Marketing Location Madrid marketing middle-east Office Online hate Saudi Arabia Social social content Socialize social media social media agency Statistics Team tik tok tiktok tokyo Tourism trends Video Production Tag We Are Social White paper Wins

#22 Boutique Offices
Knowledge Village - Dubai 34873
Phone: +971 4 368 9277
Email: hello@socialize.ae

© 2019 Socialize Agency.

| Privacy policy
Links
  • Home
  • About Us
  • What we do
  • Our Work
  • News Room
  • Join us
  • Contact Us
Recent Posts
  • We Are Social's Monday Mashup #471 December 9, 2019
  • Trending Social 🔥 7 December 2019 December 7, 2019
From Instagram
Get in touch